
What 57 LLM Benchmark Runs on an AMD Instinct MI300X Taught Me About VRAM, Throughput, and Quantization
I built AMD LLM Lab to understand LLM inference performance before running the model.
How much VRAM does a model actually need?
How does model size affect generation speed?
Does quantization always reduce memory?
Does lower precision always make inference faster?
I wanted to answer these questions using measured data rather than relying only on theoretical parameter-count calculations.
That led me to build AMD LLM Lab, an open-source research platform for benchmarking and modeling LLM inference performance.
Live Lab: https://amd-llm-lab.vercel.app/
GitHub: https://github.com/VedantJadhav701/AMD\_LLM\_LAB
The Experiment
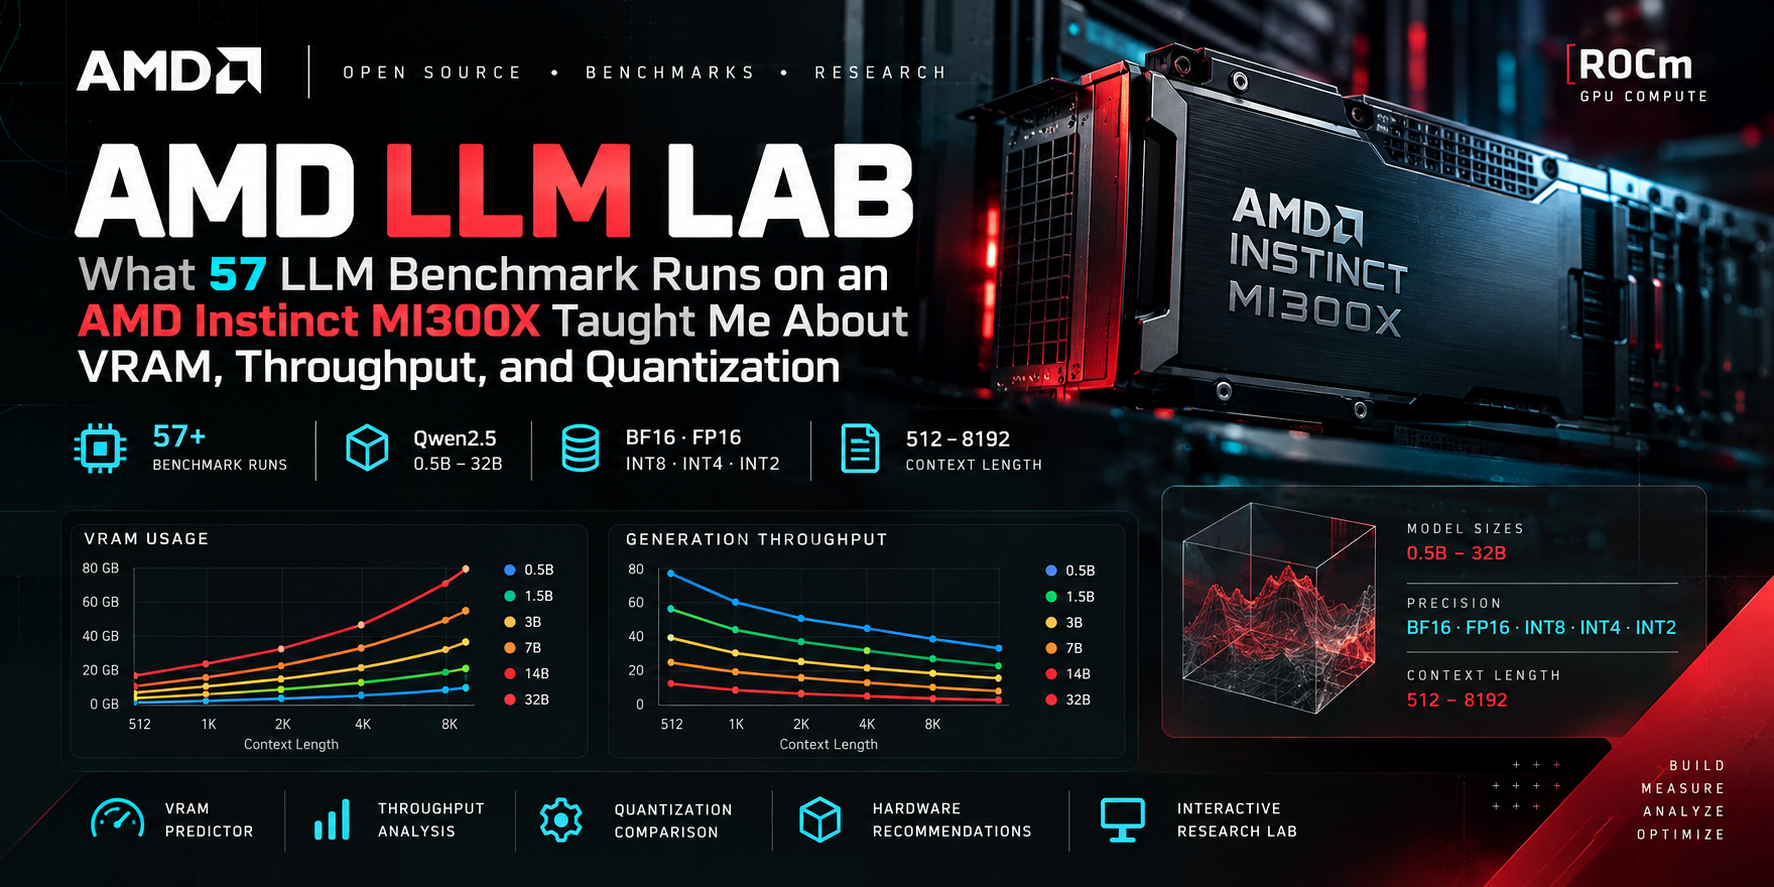
The benchmark environment was an AMD Instinct MI300X with approximately 192 GB of GPU memory, running the ROCm software stack.
I benchmarked multiple Qwen2.5 model sizes and different precision configurations, measuring:
Peak GPU memory
Generation throughput
Model size
Precision
Quantization configuration
Context length
Inference backend
The resulting dataset contains 57 measured configurations.
The model sizes ranged from 0.5B → 1.5B → 3B → 7B → 14B → 32B.
The benchmark included configurations using BF16, FP16, INT8, INT4 and INT2, with context lengths from 512 to 8192 tokens.
The goal wasn't simply to find the fastest configuration. It was to understand the relationship between model size, memory, precision and inference throughput.
Why Parameter Count Isn't Enough
A common way to estimate whether a model will fit into GPU memory is:
Parameters × Bytes per Parameter
For example, a 7B model in FP16 requires roughly:
7 billion × 2 bytes
≈ 14 GB
But that isn't the complete inference memory requirement.
Actual inference can also involve:
KV cache
Activations
Runtime allocations
Framework overhead
ROCm allocator behavior
Context length
Quantization implementation
So two configurations with the same number of parameters can behave differently in practice.
That's why I wanted to measure actual inference behavior.
What I Measured
For every benchmark configuration, I collected runtime characteristics and stored them in a structured dataset.
Peak VRAM
The maximum GPU memory allocated during inference.
Generation Throughput
Measured in:
tokens / second
Context Length
The benchmark covered:
512
1024
2048
4096
8192
This allowed me to investigate both model scaling and context effects.
Model Scaling
One of the clearest patterns was the relationship between model size and memory consumption.
As model size increased, peak VRAM generally increased as well.
Across the benchmark dataset, measured peak VRAM ranged from approximately:
4.20 GB → 68.77 GB
Measured generation throughput ranged from approximately:
4.27 → 78.32 tokens/sec
This gave me two different dimensions to analyze:
Model size
     ↓
VRAM requirement

Model size
     ↓
Generation throughput
A configuration can therefore fit comfortably in memory while still being relatively slow.
Quantization Was More Interesting Than Expected
One of the questions I wanted to investigate was whether lower-bit quantization always produces better inference characteristics.
The intuitive assumption is:
FP16
 ↓
INT8
 ↓
INT4
 ↓
INT2

Lower precision
      ↓
Less memory
      ↓
Faster inference
The measurements did not support such a simple rule.
In the tested environment, some lower-bit configurations reduced memory while also substantially reducing generation throughput.
This means that quantization is not simply a memory optimization problem.
Its behavior depends on factors such as:
Quantization method
Backend
Model architecture
Kernel implementation
Hardware
Precision
Runtime
This is one of the reasons empirical benchmarking is useful.
From Benchmarking to Prediction
Once I had the measured dataset, I wanted AMD LLM Lab to do something more useful than display benchmark tables.
The next question became:
What happens when a user selects a configuration that hasn't been directly benchmarked?
For example:
Model:       Qwen2.5 7B
Precision:   FP16
Context:     4096
If that exact configuration isn't present in the dataset, the application shouldn't pretend that a measured result exists.
Instead, AMD LLM Lab distinguishes between three types of results.
MEASURED
A configuration directly observed in the benchmark dataset.
ESTIMATED
A prediction generated from the performance models.
INTERPOLATED
A value derived from nearby measured configurations.
This provenance is displayed directly in the application.
Building the Predictive Layer
I trained models to estimate two important quantities:
Peak VRAM
Generation throughput
The input features include:
Model parameter count
Context length
Precision
Quantization
Backend
GPU characteristics
The purpose is not to claim that a relatively small benchmark dataset can perfectly predict every possible LLM workload.
Instead, the predictor acts as a planning tool grounded in the measured MI300X observations.
The evaluation uses held-out configurations rather than simply reporting performance on the same observations used for training.
Turning the Research Into a Tool
The project eventually became more than a collection of notebooks.
I built AMD LLM Lab as a complete application:
Benchmark Dataset
       ↓
Predictive Models
       ↓
Estimation Layer
       ↓
Recommendation Engine
       ↓
FastAPI
       ↓
Next.js
       ↓
Interactive Research Lab
The platform currently provides:
Benchmark Explorer
VRAM Predictor
Throughput Predictor
Configuration Recommender
Quantization Analysis
Scaling Analytics
Local Hardware Detection
Device-aware planning
The goal is to make the benchmark data useful to someone who wants to answer:
"What should I run on my hardware?"
rather than requiring them to inspect a CSV manually.
Your Hardware Matters Too
A benchmark on an MI300X doesn't mean the same configuration will behave identically on a smaller consumer GPU.
AMD LLM Lab can detect local hardware such as:
GPU
GPU memory
System RAM
CPU
Operating system
and use those constraints when planning configurations.
The application therefore separates:
Benchmark observation
        ≠
Device-specific prediction
This distinction is important because the current benchmark dataset is based on the MI300X environment.
What I Learned
The biggest lesson from the project is that LLM inference performance is a configuration problem, not simply a parameter-count problem.
Model size matters.
But so do:
Precision
Quantization
Context length
Backend
Runtime implementation
Hardware
A 7B model is not simply "a 7B model."
Its actual inference characteristics depend on how and where it is executed.
Limitations
There are several limitations to the current work.
The benchmark dataset is currently focused on AMD Instinct MI300X and a limited set of model configurations.
Therefore, these results should not be interpreted as universal performance laws for all GPUs, models or inference frameworks.
The predictive models are also constrained by the coverage and diversity of the underlying measurements.
More measurements across:
Additional model families
Additional AMD GPUs
Additional context lengths
Batch sizes
Inference backends
Repeated benchmark runs
would make the system substantially stronger.
These limitations are part of the research rather than something I want to hide.
What's Next?
The next stage of AMD LLM Lab is focused on expanding the benchmark ecosystem.
The longer-term direction is:
More Models
     +
More AMD GPUs
     +
More Configurations
     +
Community Benchmarks
     ↓
Larger Dataset
     ↓
Better Performance Models
     ↓
Better Hardware Recommendations
I also plan to turn the current benchmark work into a formal research paper focused on empirical modeling of LLM memory and inference throughput on AMD Instinct hardware.
Try AMD LLM Lab
The complete project is open source.
Live Lab
https://amd-llm-lab.vercel.app/
GitHub
https://github.com/VedantJadhav701/AMD\_LLM\_LAB
The repository contains the benchmark dataset, backend, prediction models, dashboard and reproducibility instructions.
Final Note
AMD LLM Lab is an independent open-source research project, not an official AMD product.
The purpose is straightforward:
Measure what we can. Model what we haven't measured. Make the uncertainty visible.